PNC
“Christmas Price Index”
My Contribution
Engagement Type
Case Study
All Aboard the Christmas Price Index
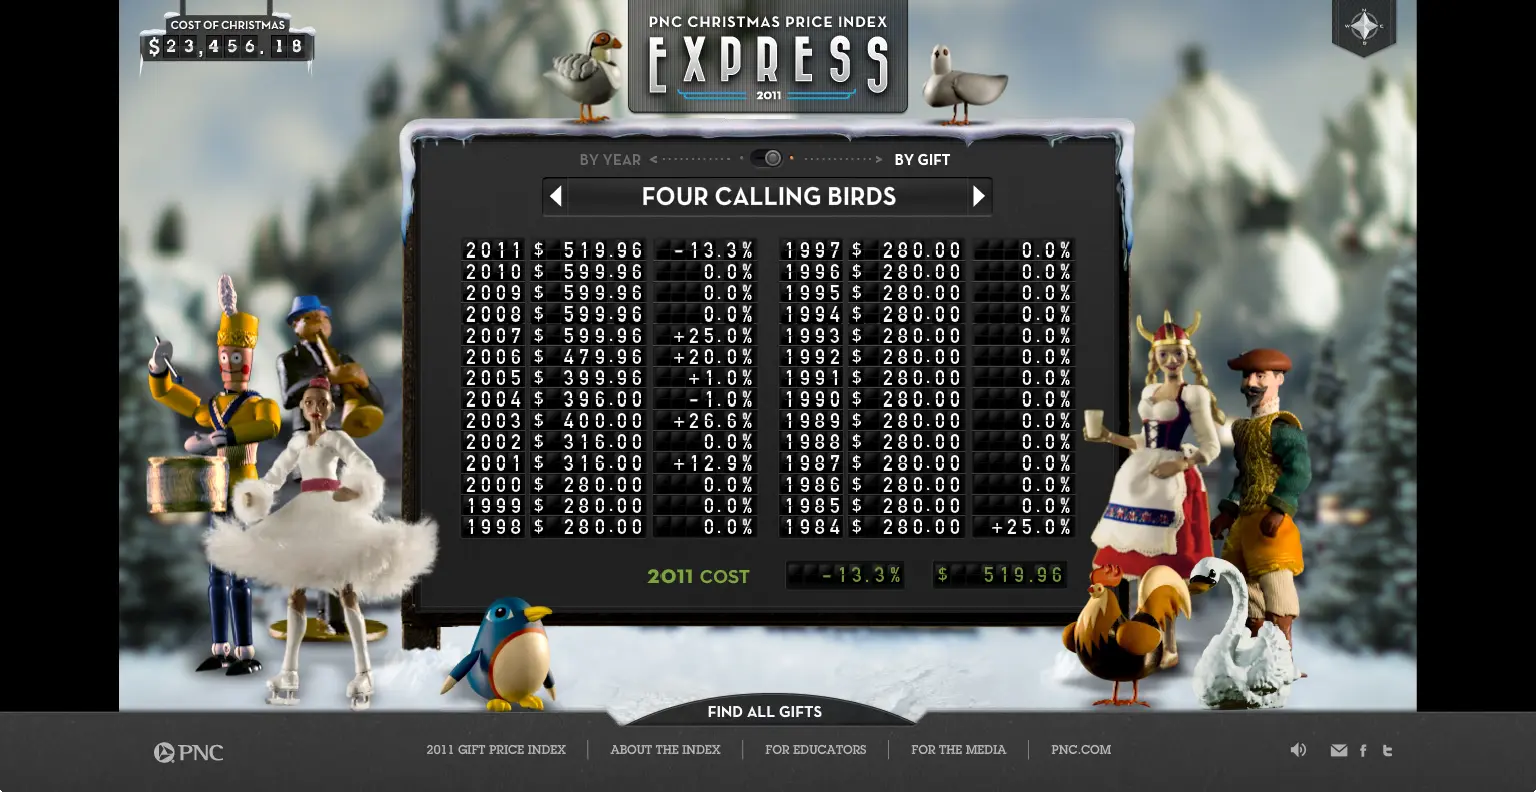
For the 28th annual PNC Christmas Price Index, we transformed a long-running economic tradition into an interactive train journey through a winter wonderland, with visitors traveling from stop to stop to discover the changing cost of the gifts from The Twelve Days of Christmas.
PNC has published the Christmas Price Index since 1984, using the gifts from the classic holiday song as an accessible way to explore inflation and changing prices. In 2011, one set of the twelve gifts cost $24,263.18, an increase of 3.5% over the previous year. Buying every gift in all of the song’s repeated verses pushed PNC’s “True Cost of Christmas” above $100,000 for the first time, reaching $101,119.84.
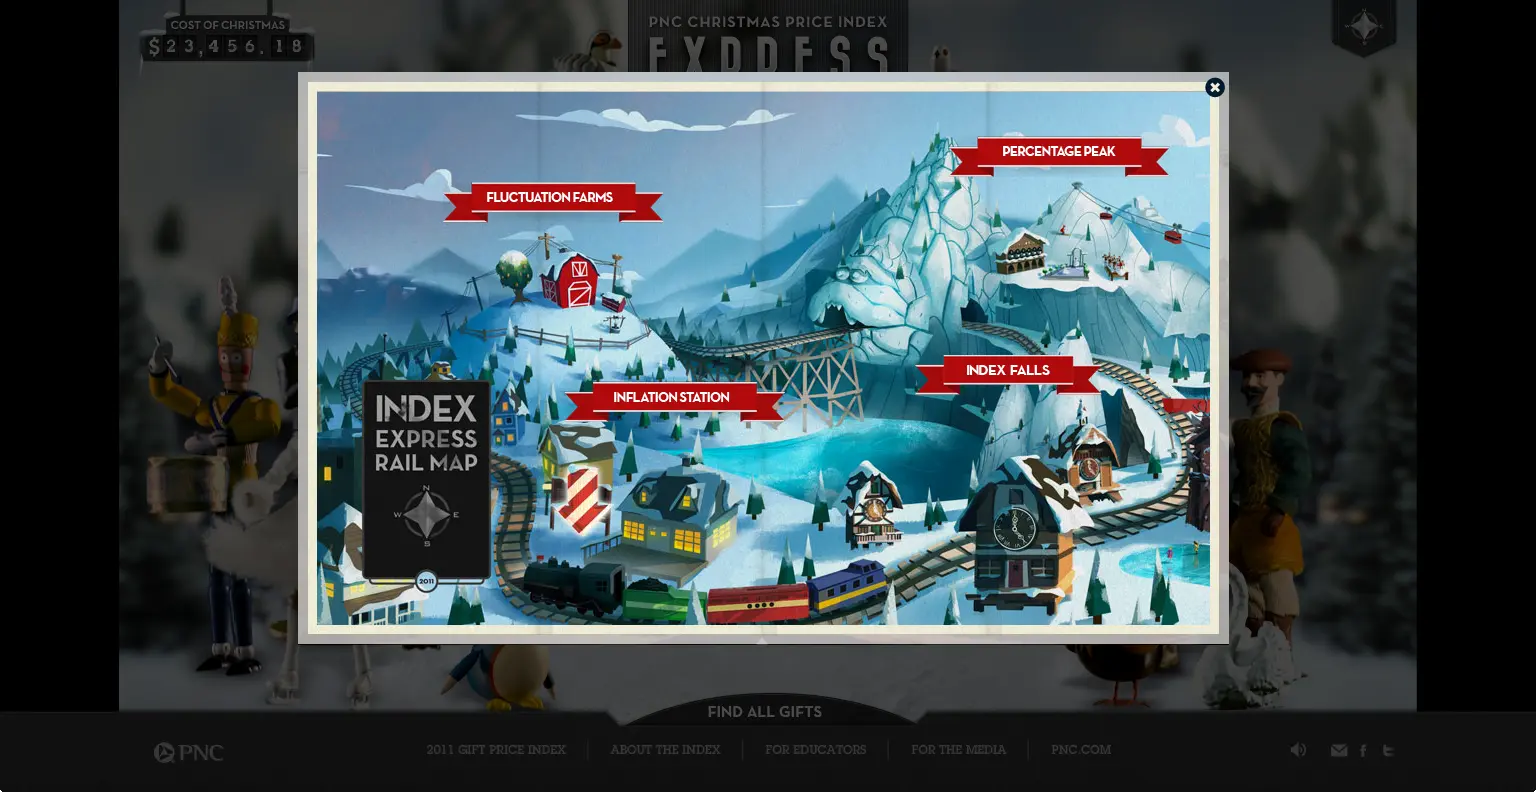
Rather than presenting those numbers as a conventional financial report, the project turned them into an interactive holiday experience. A model train carried visitors through a series of destinations, combining animation, video, games, and the Price Index data into a playful narrative built around exploration.
Developing the Interactive Journey
As a Senior Interactive Developer, I personally developed major portions of the experience, including several of the mini-games and the primary interface that moved visitors between stops along the train’s journey.
The train functioned as more than a visual theme. It was the connective tissue for the experience. Visitors traveled along the track, arrived at different destinations, and encountered interactive moments and games tied to the larger Twelve Days concept.
I spent roughly two months working with the team to translate that idea into a functioning interactive experience. My work required bringing together interface behavior, game mechanics, animation, video, graphics, and the transitions that made separate destinations feel like parts of the same journey.
This was the kind of development work I gravitated toward early in my career. I was interested not simply in making an interface function, but in understanding how interaction, motion, visual design, sound, narrative, and technology could combine to create an experience people wanted to explore.
Where Physical Production Met Digital
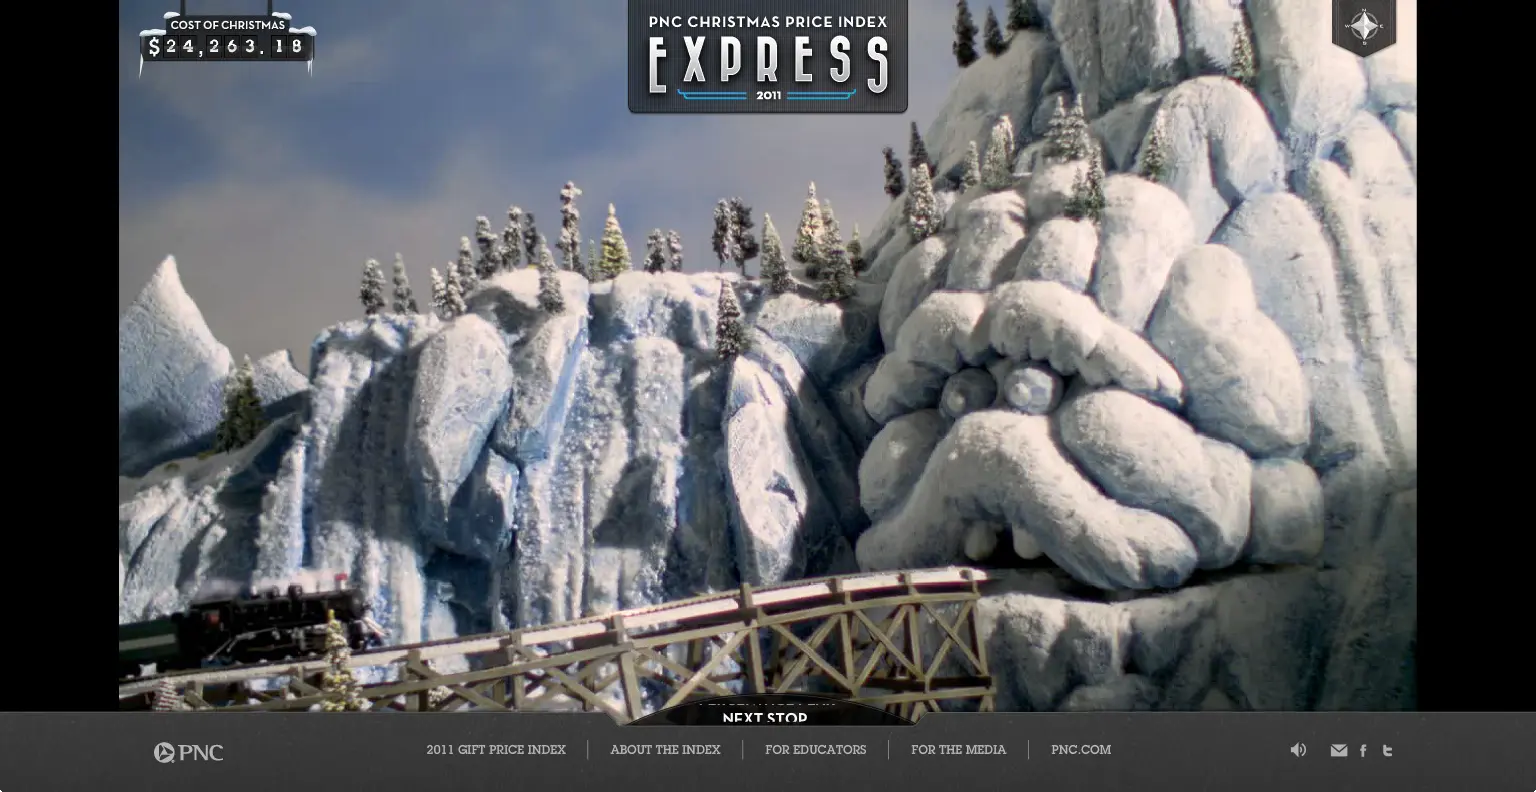
One of the things that made the project memorable was how much of the experience was created under one roof: the miniature sets, model train, stop-motion animation, video production, post-production, 3D graphics, and interactive development were all produced in-house.
The physical shoot took place at our office using miniatures and a model train. I worked alongside the production process and contributed to discussions around the shoot, then helped translate the resulting material into the interactive experience. Stop-motion, video, post-production, and 3D graphics became ingredients in the product rather than assets developed in isolation from it.
That proximity between disciplines was especially valuable. As a developer, I could see how decisions made during production would ultimately affect interaction and implementation, while creative and production teams could work alongside the people responsible for turning those assets into the final digital experience.
Contributing Beyond the Code
Although my role at the time was Senior Interactive Developer, my involvement was not isolated to implementation. I participated in meetings with PNC and Deutsch, contributed to project discussions, and worked across technical, creative, and production disciplines as the experience took shape.
That exposure mattered. It gave me an increasingly broad view of how ambitious digital work gets made: client objectives and creative ideas have to survive schedules, production realities, technical constraints, implementation decisions, testing, and the countless conversations connecting those pieces.
At this stage of my career I was still primarily a hands-on developer, but experiences like this were expanding how I thought about the work. I was becoming as interested in how teams arrived at decisions and worked together as I was in the implementation itself.
Making Economics Playable
The finished experience gave a nearly three-decade-old financial index a very different interface, turning economic data into a journey audiences could play through rather than simply read.
The 2011 Price Index provided plenty of material for that storytelling. PNC reported that the cost of one complete set of gifts increased 3.5% to $24,263.18, while the True Cost of Christmas rose 4.4% to $101,119.84. It was the first time the cumulative cost of all 364 gifts in the song crossed the $100,000 threshold.
The interactive train, miniature environments, stop-motion sequences, games, video, and price data gave those statistics a sense of place and personality. Each stop became another opportunity to reveal part of the index while keeping visitors moving through the larger experience.
Recognition
The 2011 PNC Christmas Price Index experience won the 2012 Internet Advertising Competition Award for Best Bank Website.
The award recognized the interactive winter-wonderland concept built around the toy train journey. For me, the project remains memorable not only because of the recognition, but because it brought development, games, physical production, stop-motion, video, 3D, design, and storytelling together in a way that made the entire production process visible to the people building it.
Establishing My Leadership Style
This project helped crystallize a leadership philosophy I still apply today: leadership is not about announcing who is right and who is wrong. It is about giving people context, establishing the objective, creating alignment, and guiding them toward stronger decisions without diminishing their contribution.
At the time, I was a Senior Interactive Developer, but I was also paying close attention to how different leadership styles affected creative and technical teams. I learned that simply labeling an idea right or wrong might produce a decision, but it does not necessarily build understanding, strengthen the team, or help someone make a better decision the next time.
My experience as an Adjunct Associate Professor helped shape the alternative I began developing. Teaching reinforced that people respond better when they understand the reasoning behind a direction. Today, when I lead teams, I try to provide that context: what we are trying to accomplish, what constraints matter, where a proposed solution may fall short, and why another direction may better serve the product, audience, or business objective.
That does not mean avoiding difficult feedback or lowering expectations. It means making feedback useful. I want people to leave a discussion with greater clarity and shared ownership of the direction, not feeling smaller because an idea was simply declared wrong.